
The Stress Test Framework of Sovereign AI Strategies: Introducing the TIP Triangle
A framework that scores sovereign AI resilience and readiness, then breaks it under pressure and reveals cascading scenarios. The interactive model is live, available for testing.

Readiness indices rank the world at rest. The world is not at rest.
Governments from Paris to Riyadh to New Delhi have committed tens of billions to domestic compute. The IEA expects data-centre electricity demand to reach roughly 945 TWh by 2030, slightly above Japan’s entire consumption today. The siting decisions being made right now will bind national capability for thirty years.
Almost every tool guiding those decisions measures the world at rest. Readiness indices benchmark what exists today: compute stock, talent pools, regulatory quality, capital. They are snapshots. They tell you who leads. But they do not describe what happens to that lead when a strait closes, an export control lands, or a drone finds a data centre.
In the first quarter of 2026, that stopped being hypothetical. Military action in the Middle East began on February 28, the Strait of Hormuz moved to a de facto closure within days, and Iranian drones struck operational data centres in the Gulf.
Today I am publishing what I have been building and testing privately since January: the TIP Triangle, a framework that scores sovereign AI readiness and then subjects the scores to stress. The interactive model is live at the link below. You can run the scenarios, change my assumptions, and break it.
[→ Open the interactive TIP Triangle demo]
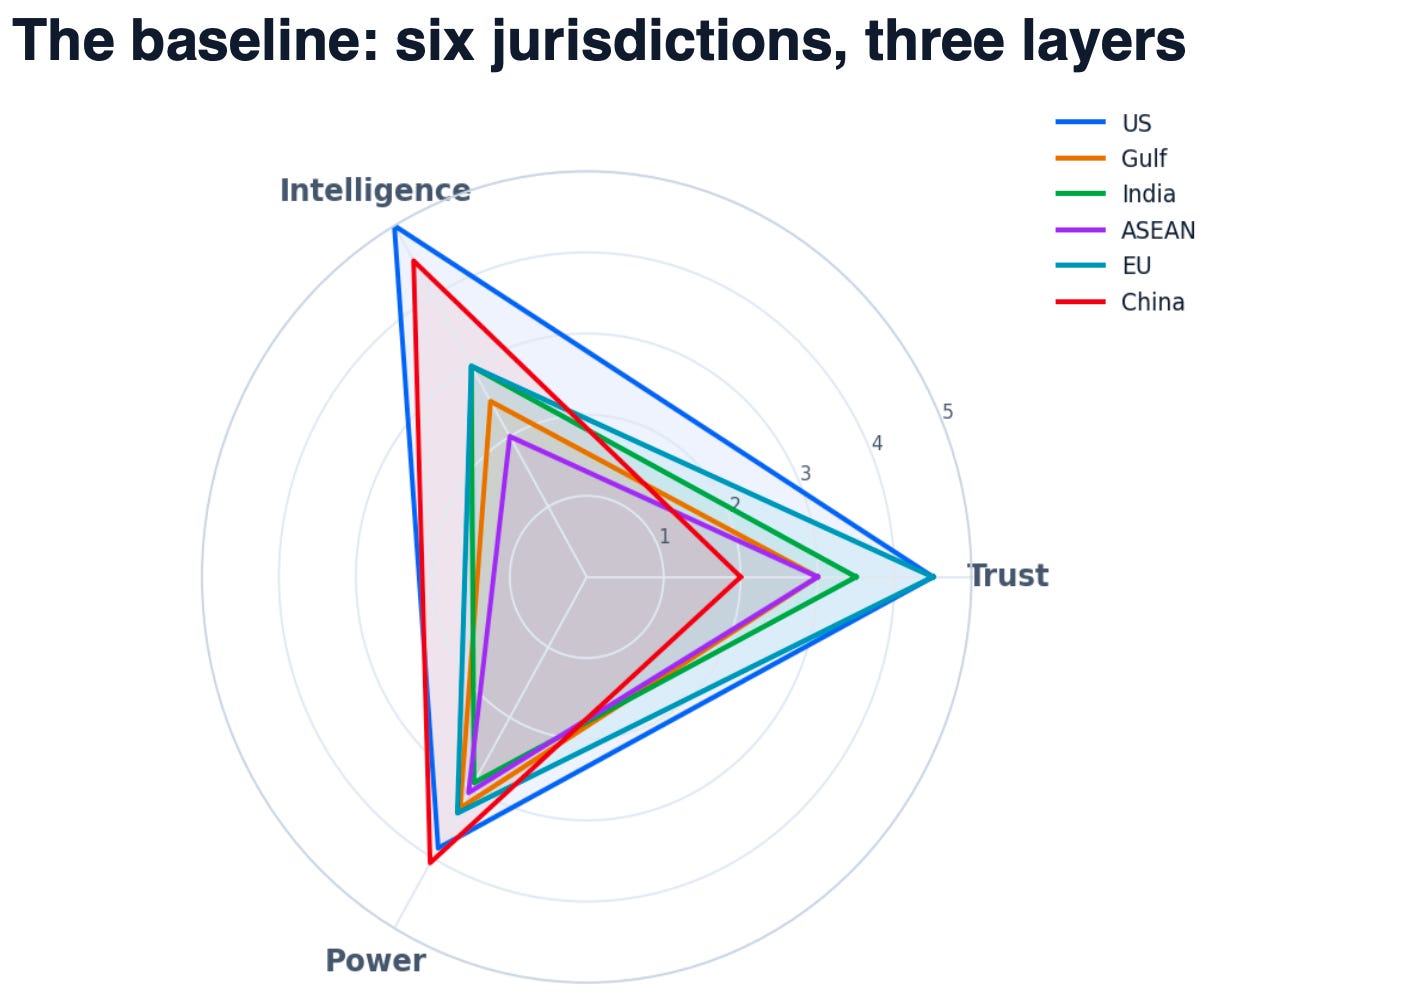
The framework scores six jurisdictions (United States, Gulf, India, ASEAN, European Union, China) on a 1 to 5 ordinal scale across three layers. Trust covers institutional reliability and geopolitical alignment: can partners depend on this jurisdiction’s commitments, data regimes, and export behaviour. Intelligence covers talent, research depth, and model capability across five subdimensions. Power is the physical layer, and the reason the framework exists: grid headroom, energy diversity, cooling, physical security, connectivity, sovereign capital, permitting. Most assessments treat this layer as a footnote. It is the binding constraint on everything above it.
Every score is documented. Where hard data exists, it is cited in my methodology paper (available to premium subscribers). Where structured judgment fills a gap, the methodology says so. The scales are ordinal, so the outputs are directional and comparative. A 4.0 beats a 3.0; it is never “33 percent better.” That kind of precision on questions like these, should always be questioned.
The baseline rendered above already paints strategic realities. The US runs strong on every layer, with one exception buried inside Power: permitting, scored 1.5, the worst of any jurisdiction except the EU. China pairs the deepest build capacity in the set (a Power composite of 4.07, the highest of the six) with the lowest external trust (2.0). The Gulf holds the global maximum on sovereign capital and the fastest permitting anywhere, alongside concentrated exposure in energy diversity, cooling, and physical security.
That last profile matters, because fragility lives in the gap between a jurisdiction’s strongest and weakest layer. Which is where the framework does its real work.
The core of the TIP Triangle is a cascade engine: 41 documented transmission rules that propagate a shock across layers and across borders. Shock one dimension of one jurisdiction and the engine follows the consequences along causal chains the methodology maps explicitly: gas-supply cascades, the water-cooling trilemma, insurance freezes, capital redistribution, cable severance, sovereign-capital diversion.
The signature scenario is a four-stage Strait of Hormuz escalation, from tanker harassment to prolonged closure. Run it and the Gulf’s Power composite falls from 3.29 to 3.17 to 3.03 to 2.60 to 2.30. Then watch what a single composite number hides. The engine propagates the Power shock into Gulf Trust (investment review, bilateral fracture) and Gulf Intelligence (construction freeze, talent flight), then across borders into India, ASEAN, China, the US, and the EU. Eight cascades fire at Stage 3 alone.
The model separates five vulnerability types that composite indices collapse together: price exposure, physical disruption, strategic dependence, continuity of operations, and ability to keep scaling. Under Stage 3, Gulf physical disruption deteriorates to 4.7 out of 5 while price exposure moves only to 3.3. Those are different problems with different fixes, and a ranking cannot show you the difference. A jurisdiction can absorb a price shock and still lose its ability to scale. Another can hold institutional trust and prove physically fragile.
The model also declines to pretend that weighting is neutral. It ships with four selectable Power-layer weighting modes, including a system-breaker mode built on a simple observation: a collapse in physical security ends operations, while a slow permitting regime only delays them. Some constraints break systems and others degrade performance, and a framework should let you test both live. Switch modes and the Gulf’s Power composite moves from 3.29 to 2.84. The choice of weighting is an analytical claim, and the model makes you state it.
I finished the first implementation in early March 2026. The conflict’s first weeks coincided with the disruption the framework was designed to model, and I want to be precise about what that establishes. The framework had scored Gulf physical security at 2.5 before hostilities reached the region’s digital infrastructure. Iranian drones then struck operational data centres in the UAE and Bahrain, and on March 31 the IRGC named US technology firms operating in the Gulf as legitimate targets. The cascade model had mapped Gulf Power stress propagating into Trust and Intelligence; all three movements materialised within weeks. Brent started the year at $61 and closed the first quarter at $118 (EIA), the largest inflation-adjusted quarterly increase in the series going back to 1988, and the price-transmission channels the framework maps operated in real time.
That gives me directional consistency with a live stress episode.
The methodology has also been through independent expert review. The critique drove three changes you now see in the model: the weighting modes, the vulnerability taxonomy, and the explicit separation of static readiness from dynamic resilience.
The interactive demo gives you the full Hormuz escalation sequence, live sliders for every layer and Power subdimension, and the vulnerability-type analysis. The complete model (all scenarios, the four weighting modes, the transmission channels, the fragility analysis, the editable 41-rule matrix, and the custom-jurisdiction builder) is available to Sovereign Compute premium subscribers, and includes a custom-jurisdiction builder with four archetypes (allied importer, energy exporter, connectivity hub, non-aligned), so you can create and place your own jurisdiction / country inside the system and stress-test it.
[→ Open the interactive TIP Triangle demo]
Three requests. Run your own scenario and tell me where the model gets it wrong; the cascade weights are editable for exactly that reason. If you work in government, infrastructure, or capital allocation and want a jurisdiction modelled properly, reply to this email. And if the equal-weighting default does not suit you, switch modes and see how much your conclusion rests on pre-existing assumptions.
A longer report, The Power Behind the Model, is in preparation: twenty pages on the energy layer of sovereign AI, built on this framework and available to premium subscribers.
The decade’s defining infrastructure decisions are being made against static benchmarks. The TIP Triangle exists because resilience is a property you engineer before the crisis, and the only way to engineer it is to measure it.
A note on independence: All opinions shared in this newsletter are my own and do not reflect the views of dmg events, ADIPEC, or any affiliated organizations. This is personal analysis, not institutional positioning.